Use reports
See how the business is doing across revenue, sales, delivery, team, support and clients, then filter, explore, save and export the numbers.
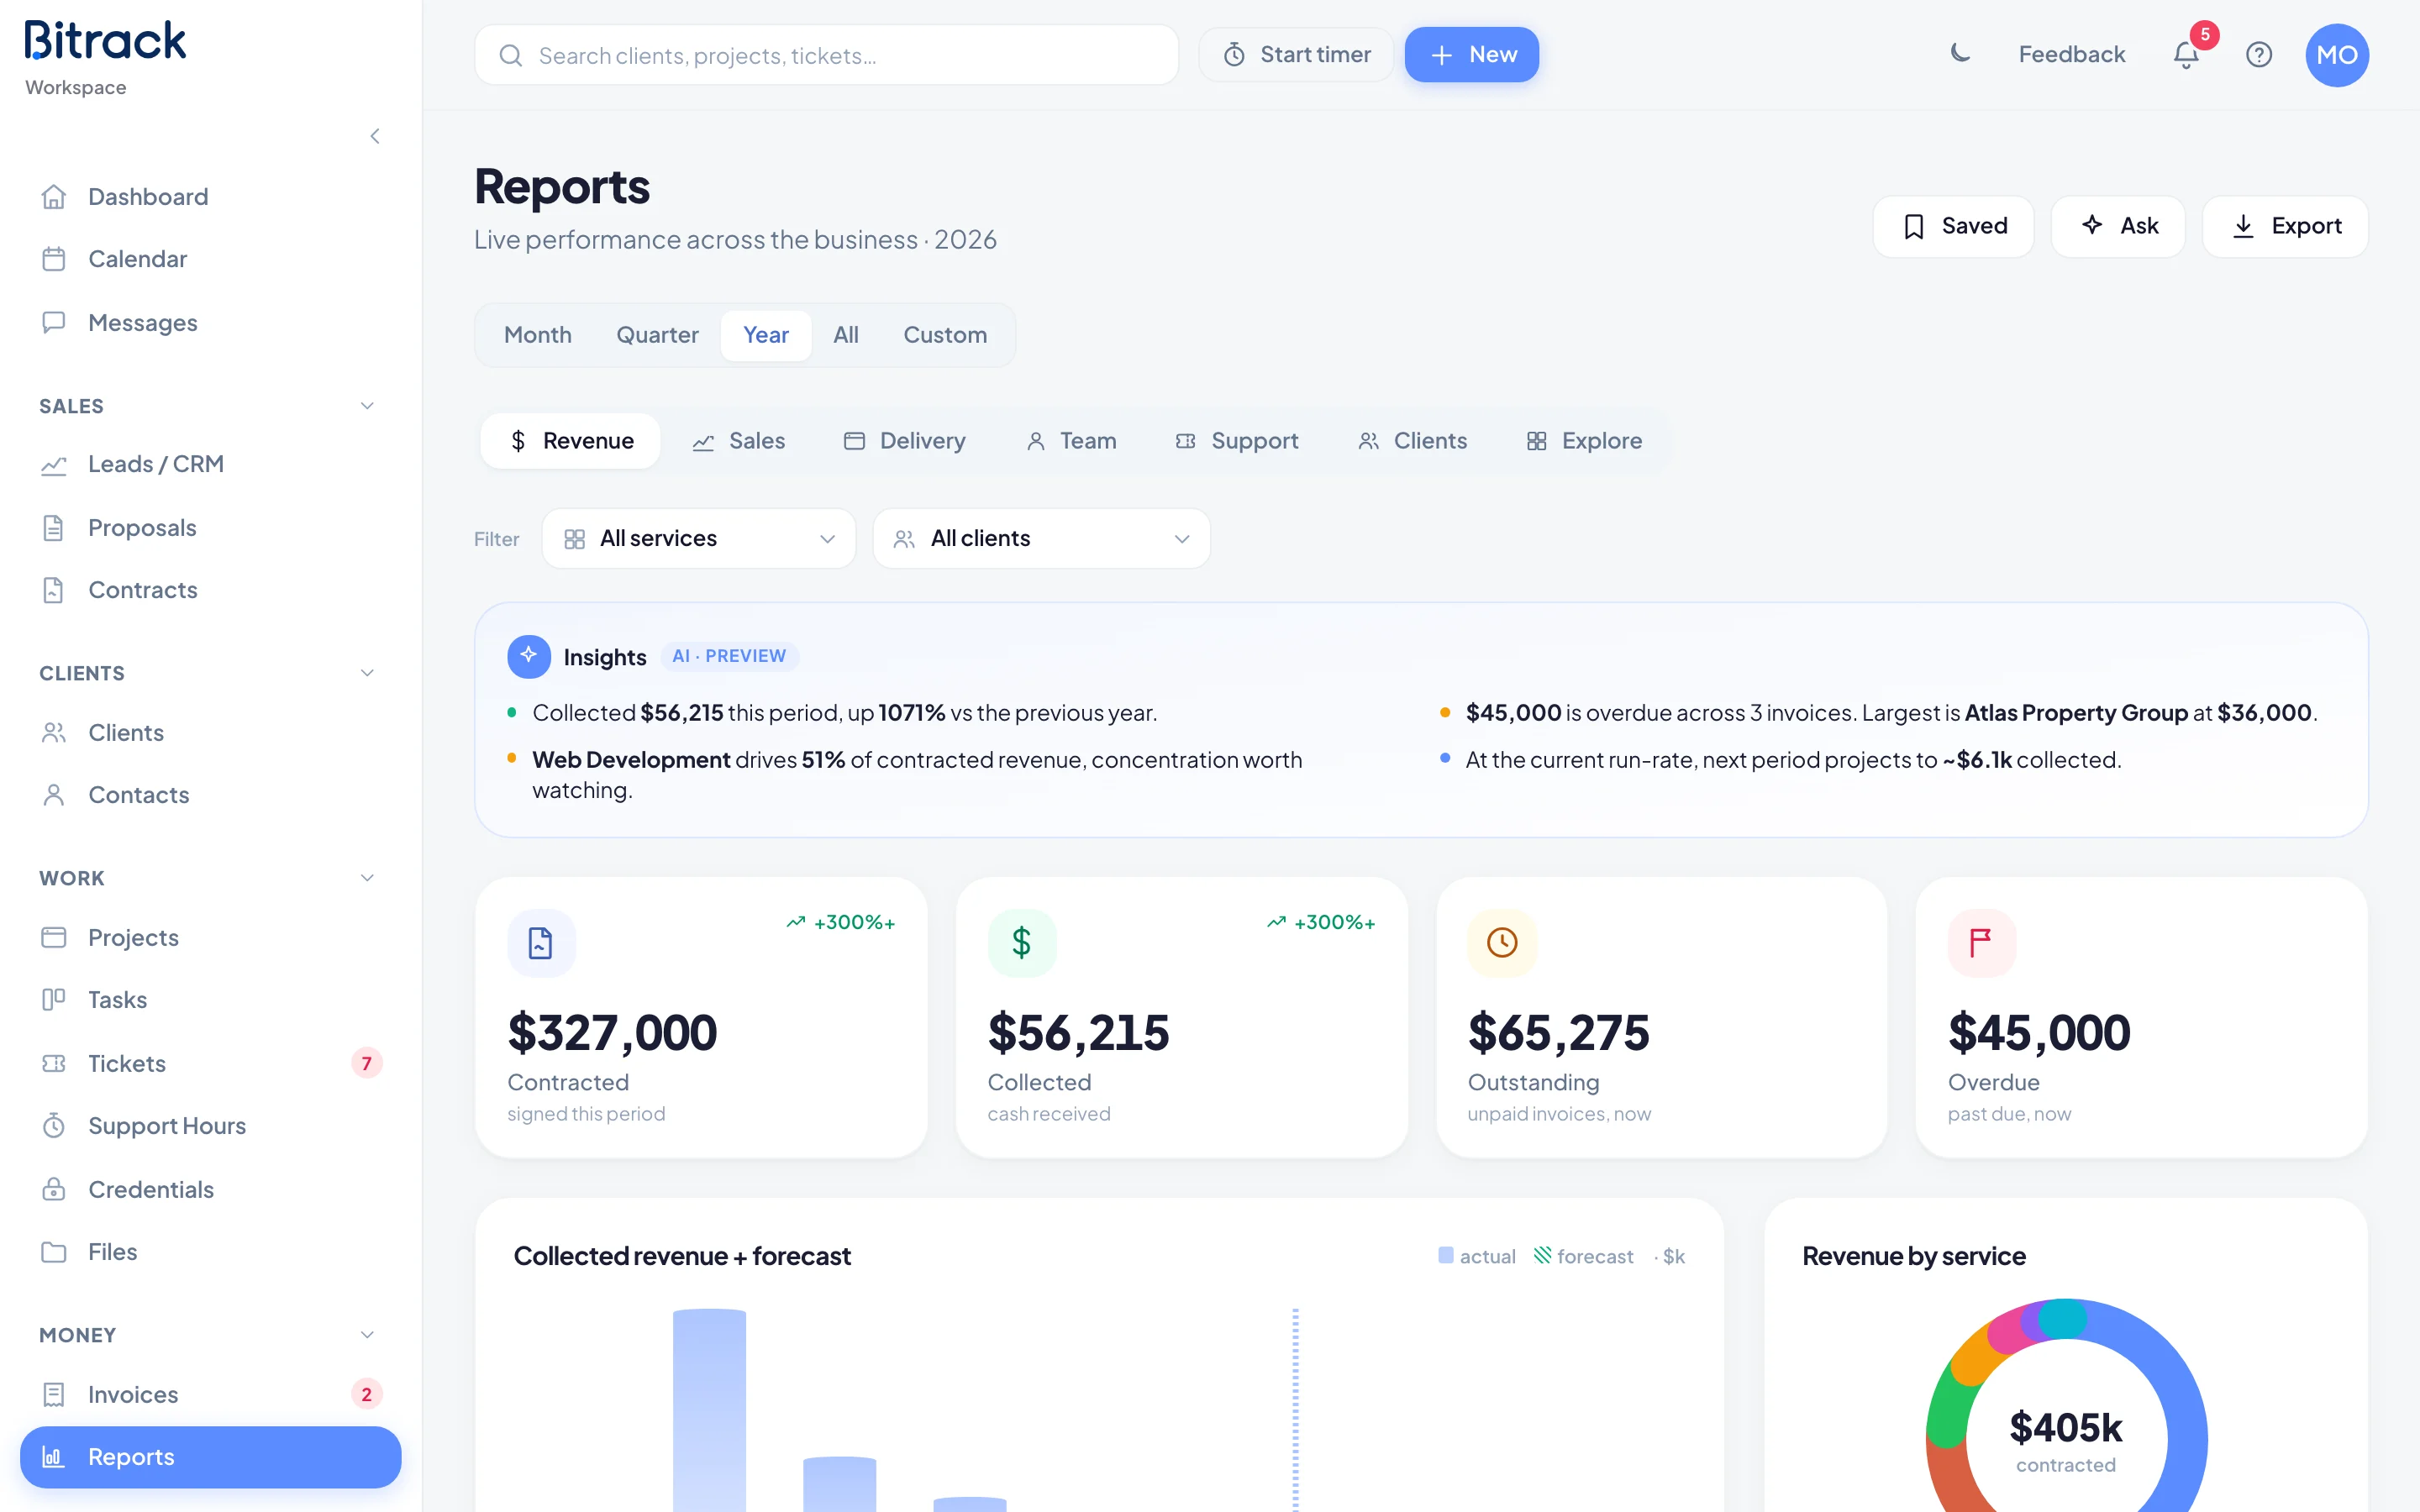
Reports shows live performance across your agency. Pick an area, a period and any filters, and the figures update straight away, compared with the period before.
What you can see
Reports is split into seven areas. You only see the areas your role allows. If you see No reports for your role, ask the Owner or an Admin for access.
| Area | What’s in it | Who sees it |
|---|---|---|
| Revenue | Collected, Contracted, Outstanding and Overdue, collected revenue with a forecast, revenue by service and by client, invoices by status, A/R aging and outstanding by currency | People who can see financials |
| Sales | Open pipeline, Win rate, Avg. deal, Proposals out, the pipeline funnel, win / loss, lead sources, leads by owner and proposal conversion | People who can see leads or proposals |
| Delivery | Active projects, At risk, Avg. progress, Overdue tasks, projects by status, project progress, tasks by status and deliverable review | People who can see projects |
| Team | Completion rate, On-time delivery, Avg. load, Overdue tasks, a performance leaderboard and ticket resolution | People who can see tasks or tickets |
| Support | Open tickets, Resolved, Urgent / high, Avg. replies, tickets by status and priority, open tickets by client and resolution | People who can see tickets |
| Clients | Client counts, top accounts, account health and clients by industry | People who can see clients |
| Explore | Build your own view from any data you can see | Everyone |
Choose a period
Use the switch at the top: Month, Quarter, Year, All or Custom. With Custom, pick a start and end date.
Headline figures show how they changed against the previous period of the same length.
Filter by service or client
Use All services and All clients under the tabs to narrow every figure to one service or one client. Choose Clear to remove them.
Insights
Most areas start with an Insights panel: a few plain-English points worked out from the live numbers, such as a big change against last period or invoices running late. It’s marked AI · preview while we improve it.
Explore your data
Explore lets you build a view yourself.
- Pick a Dataset, such as invoices, projects, tasks, tickets or clients.
- Pick what to Group by, such as status, client or month.
- Pick a Measure, such as a count or a total.
Explore follows the period and filters at the top. Choose Export CSV to download the result.
Ask a question
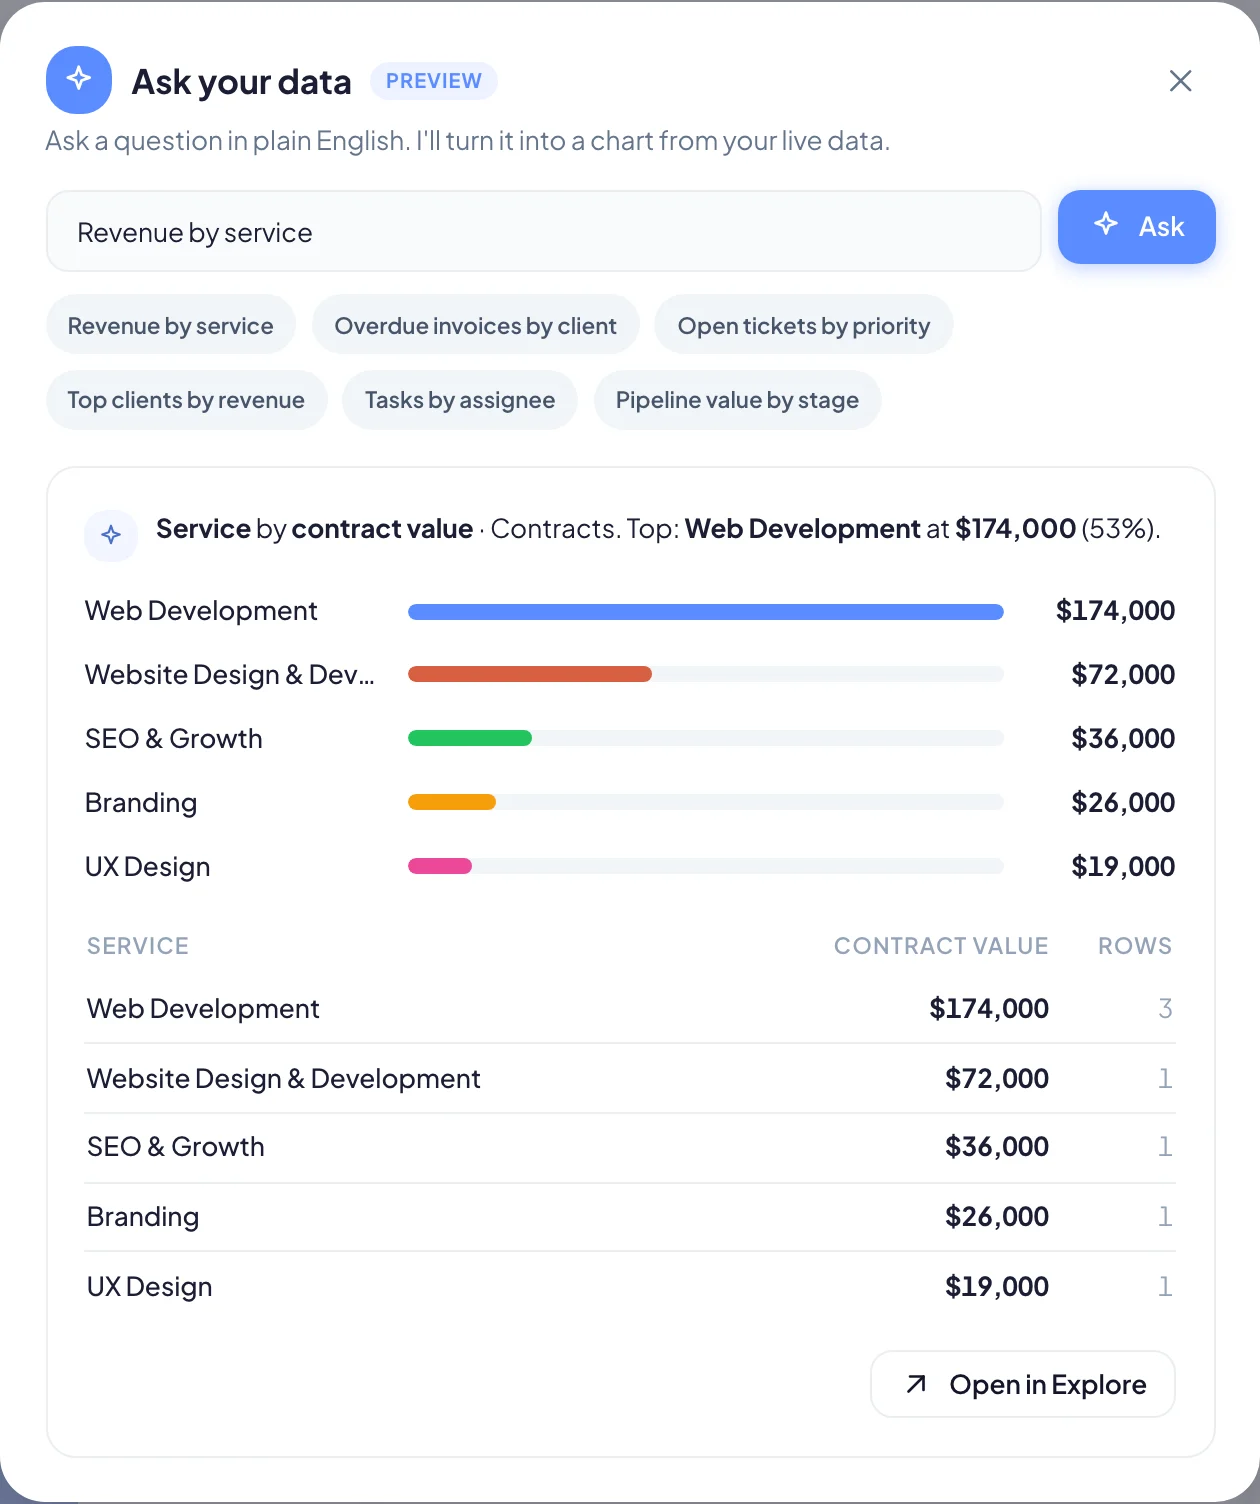
Choose Ask to open Ask your data. Type a question in plain English, such as revenue by service, or pick one of the suggestions. Bitrack turns it into a chart from your live data. Choose Open in Explore to keep working on it.
Save a view
- Set up the area, period and filters you want.
- Choose Saved, then Save this view.
- Give it a Name and choose Save report.
To open it later, choose Saved and pick it from the list. To rename or delete it, choose the pencil next to it.
Get it by email
If you can export reports, you can have a saved report emailed on a schedule.
- In the save dialog, set E-mail it to Weekly or Monthly.
- Choose the day. Reports are sent at 7:00 in your workspace’s time zone.
- Under Also send to, pick any teammates who should get it.
The email has the figures, the insights and the data as a spreadsheet. Each person gets the figures their own access allows.
Export
Choose Export to download your data. Export uses the period and filters you have on screen.
- Spreadsheet (CSV): tick the datasets you want (or Toggle all), then choose Download CSV.
- Report (PDF): choose Print / Save as PDF to print the area you’re looking at, then choose Save as PDF in your browser’s print window.